Debugging Like a Pro in Intellij
Exhausive Guide to Debug Java Application in Intellij, Must have Skill for all the Java Developer (Updated 2020)
- Introduction
- Main Basics
- Other Basics
- Break Point
- Working with Lambdas (Advanced)
- Using Memory View
- References
Introduction Permalink
Lets face it. One of the most important part of Development has always been how Efficiently one can debug and find the Internal issues in the code, and being able to debug with the best toolset in the Industry is completely feasible with Intellij for Java Developers.
To start the Debugging Short cut : Shift + F9
There are various ways to find issues in Code primarily from
- Server Logs
- Code Bookmarks
- Debugging the Code
In this Article we would be covering only 3rd point i.e. using Debugging (This Document contains Exhaustive list of tool used in java Debugging and I keep it updated with any of specialized tools which comes up.)
Main Basics Permalink
Inline Debugger Permalink
In the Debug Toolbox we can find this toolbar , which is first step one should be aware of while debugging, as these are basic toolset in all languages I haven’t covered them in detail however Once you use them you will get their Use Cases.
7 basic Operations are all below.

Step over : Permalink
(2nd icon) used to run over the particular line , one statement at a time
Short Cut : F8
Step into : Permalink
(3rd icon) Steps into the particular method during debugging
Short Cut : F7
Force Step into : Permalink
(4th icon) In case we want to step into java api methods or library methods
Short Cut : Alt +Shift + F7
Step Out: Permalink
(5th icon) When we want to step out of a particular method.
Short Cut : Shift + F8
Drop Frame : Permalink
(6th icon) In case by mistake you went ahead from the required line , we can simply drop a frame and go back
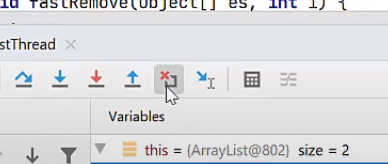
Show Execution Point : Permalink
if you are going through code and miss where the code was execution point was during debugging , click on show Execution Point
Shortcut : Alt + F10
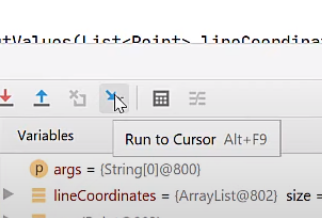
Run to Cursor : Permalink
To avoid going line by line , we can directly click on this and go the particular line straight away
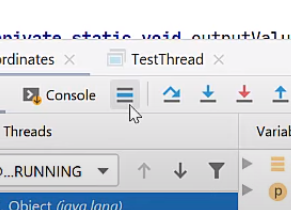
Breadcrumbs Permalink
Used to see in the IDE which particular field the cursor is pointing to , especially method or field
This is useful when working with hierarchical data like xml

Other Basics Permalink
Variable Pane Permalink
- Shows the variables that are relevant to particular stack in Frame Section

Watches Permalink
- To check the value of the variable in all the call stack , we can use watches
- Multiple ways to do it
- drag drop variable from variables tab
- right click on variable pane and click add to watches
- or in watches section add ‘+’

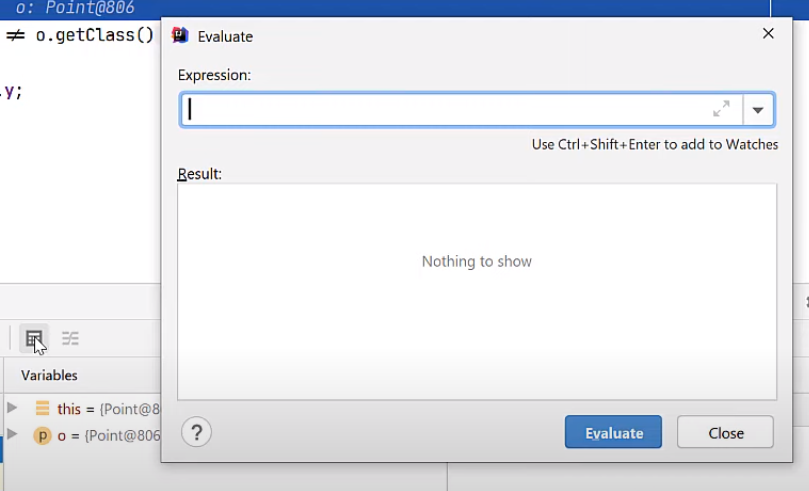
Evaluate Expression Permalink
To verify any assumptions , or test a particular statement(s) all together we can use Evaluate Expression
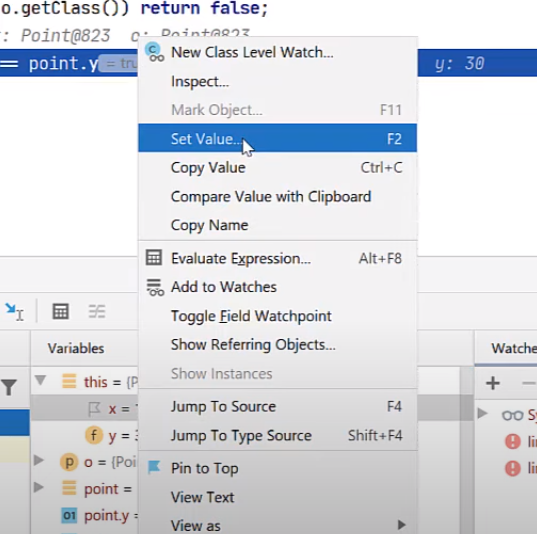
Modify code behavior without changing source Permalink
- in variable pane select the variable and right click and set value
- Behavior of the code changes
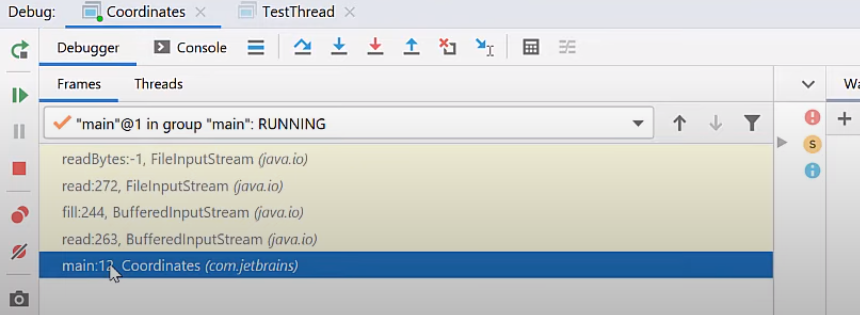
Pause (when program seems stuck) Permalink
- if program gets stuck , one can click on PAUSE button

- See the call stack from the debugger tab (Frame Section )
- To Resume : use resume button
- To Rerun : use reRun button above Resume
- To Stop debugging your program : Stop button
Break Point Permalink
- Breakpoints are there to stop the execution of a program. Add breakpoint in the gutter area

- Click on breakpoint to set conditions of when to execute
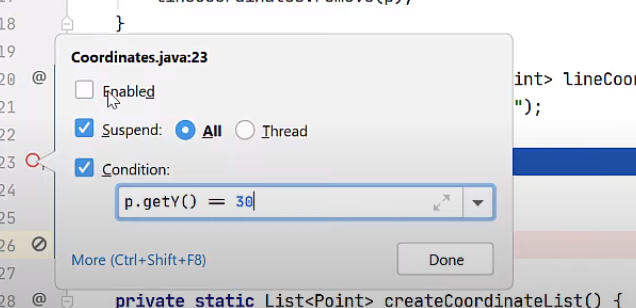
- We can Enable or Disable the particular break point
More Features of Breakpoint Permalink
Mute or Check all Break Point Permalink
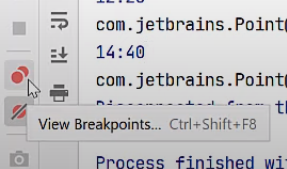
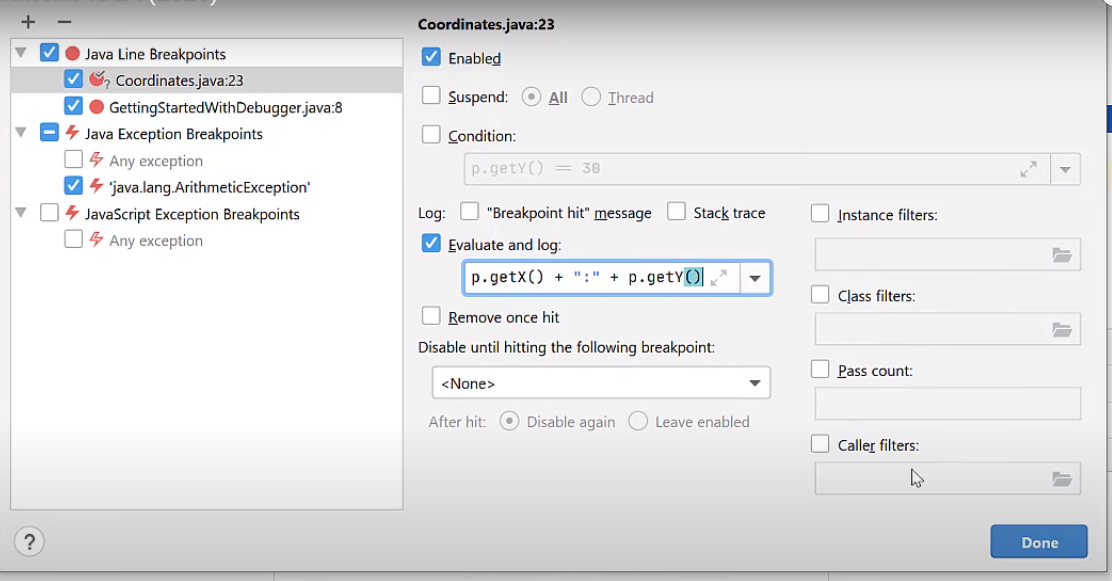
Log Rather than Suspend Permalink
- Right click on breakpoint and click on more
- rather than suspending the program we can log the breakpoint
- Note: color of such breakpoints will change
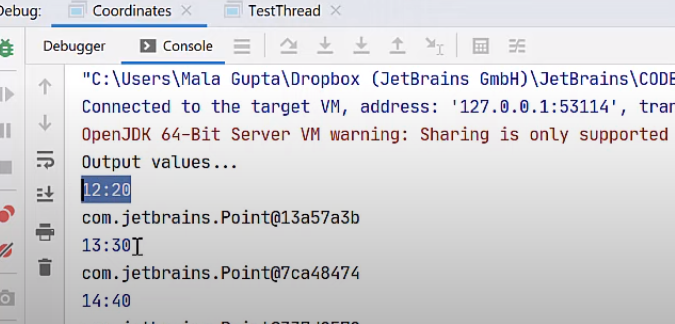
Output would be visible in the debug window
Group your Breakpoints Permalink
- Usually we want to group breakpoints for a particular purpose , this can be done in view all breakpoints then click on particular one to group it to respective groups.

Change Breakpoint Description Permalink
- In the same screen while grouping , there is also option to ‘edit Description’ this allows user to provide custom information.
Breakpoint on Interface (Method Breakpoint) Permalink
- When we use breakpoint on particular method on interface, it stops at whichever implementation gets hit
- there is change in breakpoint symbol (its a method breakpoint)

- We can specify when do we want to stop our breakpoint, method entry , exit or both
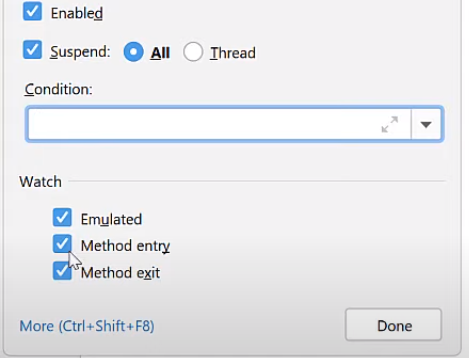
- hence we can also put breakpoints on interfaces like Runnable method ‘run’ . this would help to identify which method got called
Field Breakpoint Permalink
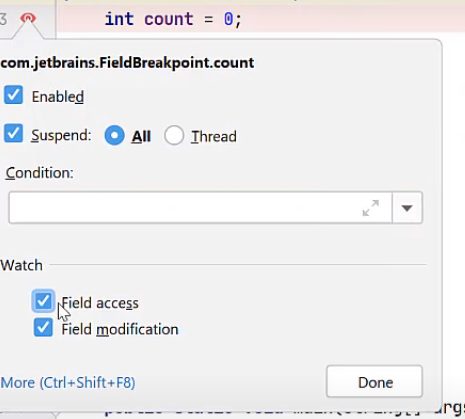
- if we are checking for a particular field value , instead of checking all the methods that modify that particular field we can directly put the breakpoint on it.
- the symbol of breakpoint is updated here as shown below
- we can also select when it should trigger , while its ‘accessed’ , ‘modified’ or both
Exception Breakpoint Permalink
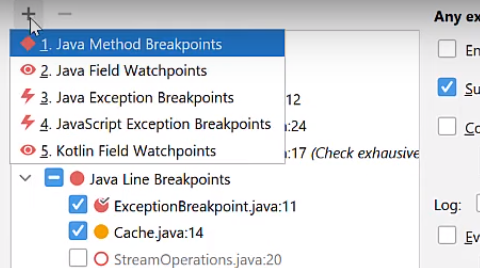
- we can select particular exception and find exact where and when its thrown using this
- Select Java Exception Breakpoint
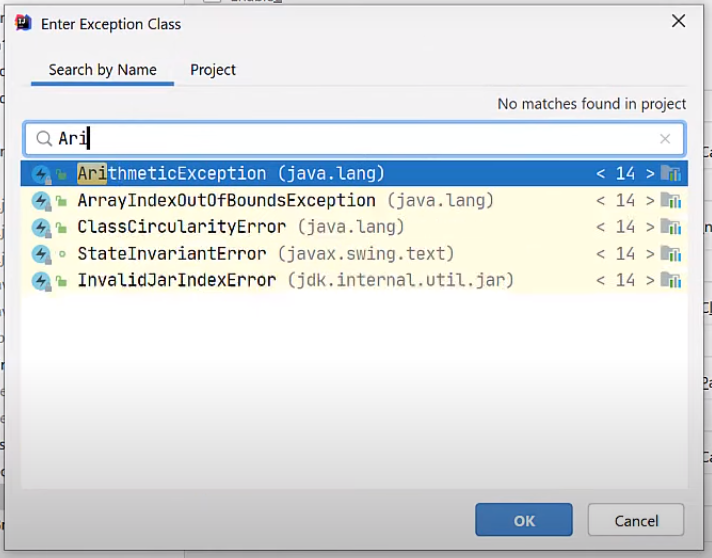
- Select you particular exception
- And hence we would be able to ‘pause’ before that exception is thrown , we can also see the values being passed in the editor pane
Working with Lambdas (Advanced) Permalink
Apply Breakpoint on Lambdas Permalink
- on Clicking set breakpoint , IDE will ask for which particular operation you want to apply debugger , we can select all , or particular lambda operator
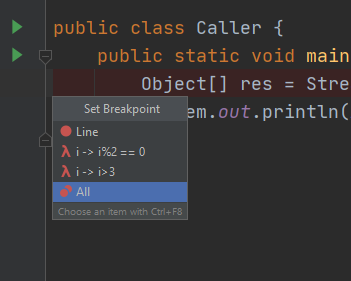
- this would allow you to test particular expression inside a lambda

Step into Permalink
- Press step into , this will highlight all the possible places in lambda where error can occur
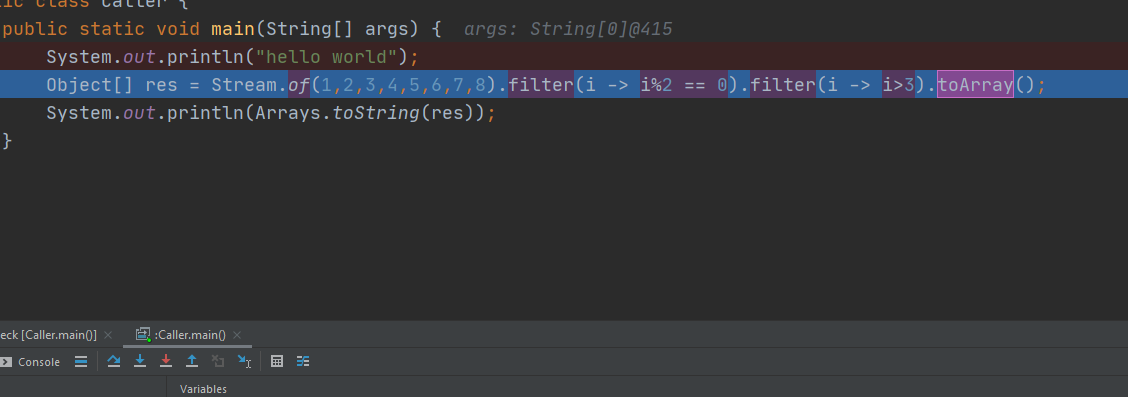
- Select the particular value and then , keep pressing Step into to iterate through all the values
Stream Debugger Permalink
- One can Debug the Streams much better using Stream debugger
- Just click the button , when you reach the particular point
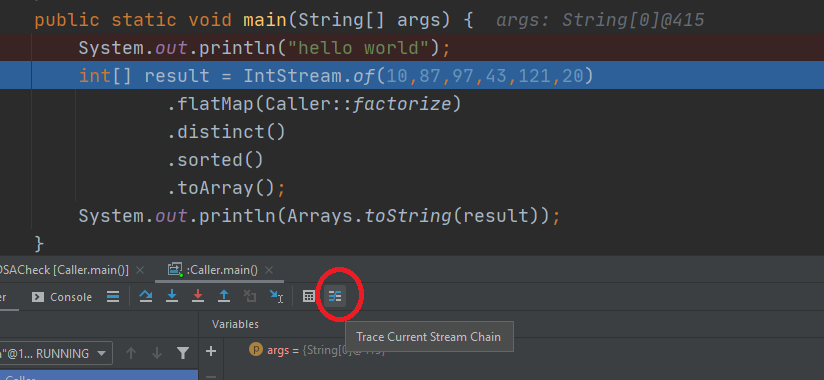
- Check how it gets exactly converted
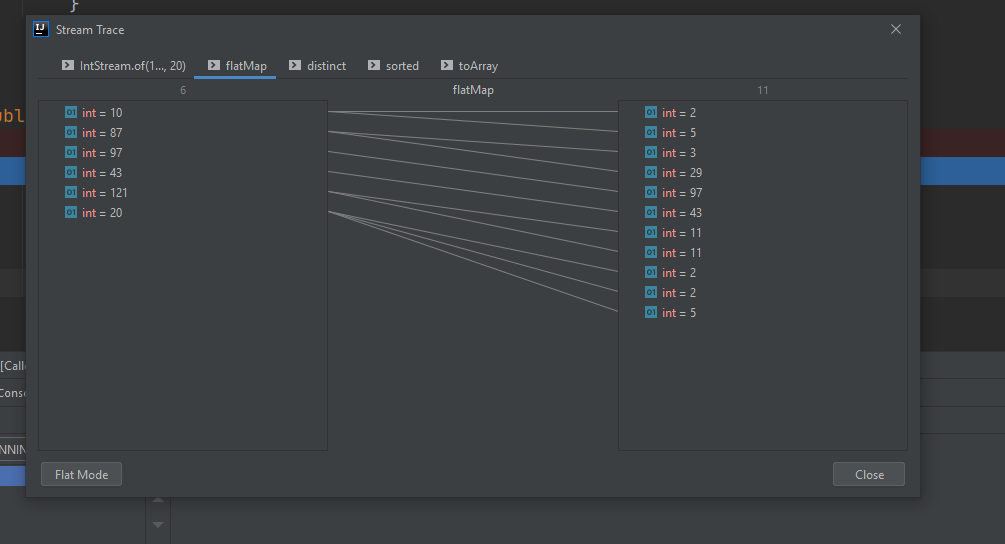
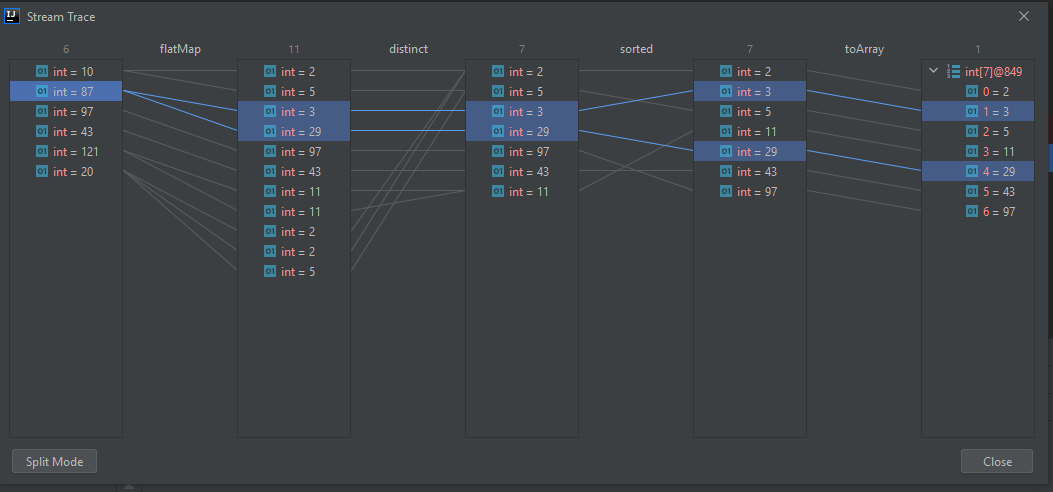
Flat Mode Permalink
- Click on flat mode to check all the operations at once
- you can also select particular value to see the operations done on the particular one.
Using Memory View Permalink
- we can track in memory how many times a particular call has been executed
- if used wisely turns very helpful in finding the objects and instances in memory
- this can be done by using debugger memory view section
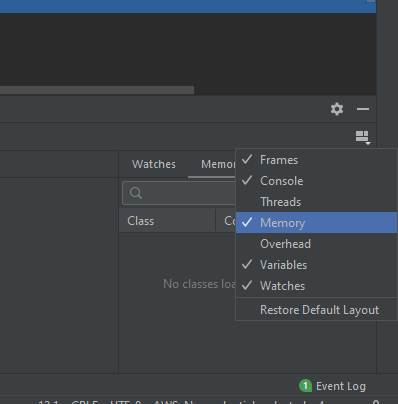
- Make sure the memory section has been enabled
- Load Classes
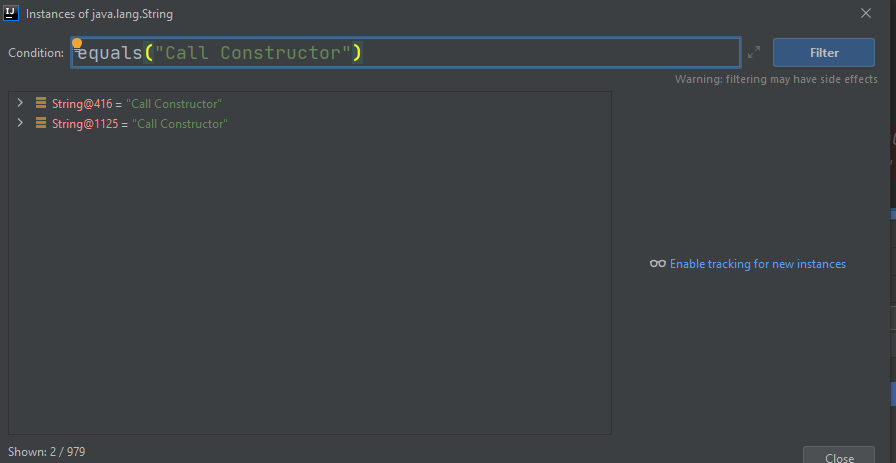
- Click on particular class , e.g. java.lang.String
- now check with ‘equals’ or any method to check the objects of that class
References Permalink
Debugging Basics Youtube Link from Intellij
https://www.youtube.com/watch?v=lAWnIP1S6UA
Advanced Debugging Features
